LBRAI2222 - Compléments de biométrie et plans expérimentaux
Résumé de section
-
Bienvenue sur le site du cours Compléments de biométrie et plans expérimentaux, qui prolonge le cours de Modélisation et exploration des données multivariées (LBIRA2110).
Ce cours aborde les modèles linéaires mixtes, largement utilisés en expérimentation agronomique, qui permettent de décomposer les différentes sources de variabilité, de les modéliser pour améliorer l'inférence sur les effets de facteurs contrôlés et de les prendre en considération dans le design d'expériences. Il aborde d'autres aspects de la planification d'expériences en R&D.
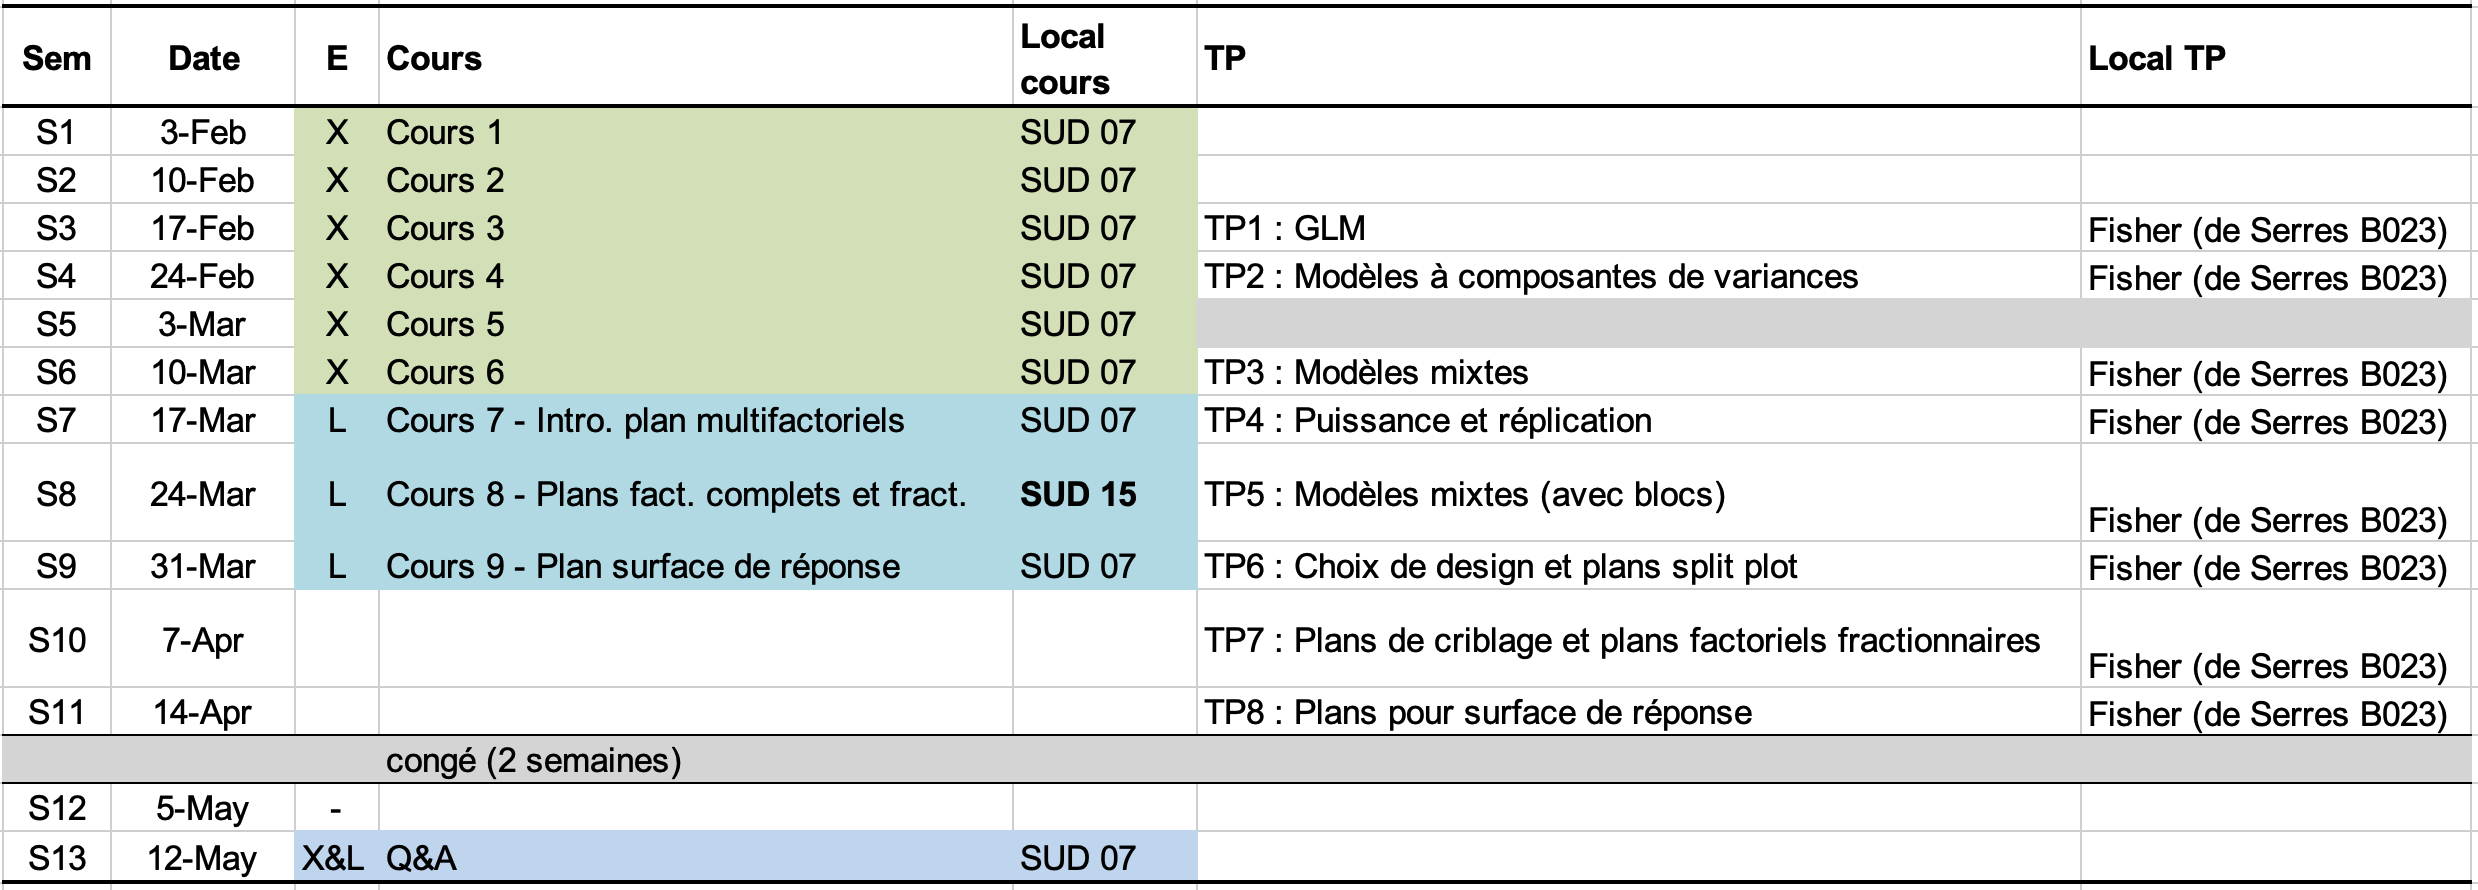
Le cours 2025 commencera en semaine S1 le lundi 3 février 2025 à 8h30 au SUD07. Le calendrier du cours se trouve ci-dessous et vous trouverez ici toutes les informations pratiques et documents liés.
Très bon quadrimestre à tous et toutes
Votre équipe: Nicolas Biot, Laura Symul et Xavier Draye
-
-
Les étudiants doiventRemettre un travail
-
-
Les étudiants doiventMarquer comme terminé4.7 Mo · Déposé le 29 avr. 24, 19:24
-
-
Les étudiants doiventConsulterEnvoyer un feedback
-
Les étudiants doiventConsulterEnvoyer un feedback
-
Les étudiants doiventConsulterEnvoyer un feedback
-
Les étudiants doiventConsulterEnvoyer un feedback
-
Les étudiants doiventConsulterEnvoyer un feedback
-
Les étudiants doiventConsulterEnvoyer un feedback
-
Les étudiants doiventConsulterEnvoyer un feedback
-
Les étudiants doiventConsulterEnvoyer un feedback
Ce dernier formulaire est un formulaire de feedback sur l'ensemble des travaux pratiques. Il nous permettra d'avoir votre avis sur le fonctionnement des travaux pratiques.
Si vous avez une question concernant ce dernier TP (ou un autre), vous pouvez directement me la poser par email (nicolas.biot@uclouvain.be) et/ou passer à mon bureau au Kellner D279. Merci pour votre Feedback !
-